
Silver jewellery export from India is a US$510.9 million trade, and most of it is being sold to people who already knew where to look. In the twelve months to January 2025, Indian customs recorded 55,800 shipments of HS 7113 jewellery reaching 9,394 identified overseas buyers across 100 countries. The demand is documented, the buyers are named in the bill-of-lading record, and the order sizes are visible. What is missing, for most Indian manufacturers, is coverage.
This article works through that gap using a real engagement — anonymised here as XYZ Exports, a Noida sterling silver manufacturer — and sets out how an Export Management Company (EMC) engagement of the kind ZJELL Limited runs converts a documented buyer list into shipped orders.
Silver jewellery export from India is a US$510.9 million trade, and most of it is being sold to people who already knew where to look. In the twelve months to January 2025, Indian customs recorded 55,800 shipments of HS 7113 jewellery reaching 9,394 identified overseas buyers across 100 countries. The demand is documented, the buyers are named in the bill-of-lading record, and the order sizes are visible. What is missing, for most Indian manufacturers, is coverage. This analysis delves into the strategies employed by XYZ Exports to bridge this gap. By collaborating with an Export Management Company (EMC) like ZJELL Limited, XYZ Exports effectively transforms identified buyer data into tangible sales. This partnership not only enhances market reach but also streamlines the export process, ensuring that manufacturers capitalize on existing demand while expanding their international presence.
What the customs record actually shows about silver jewellery export from India
Aggregate export statistics are close to useless for sales planning. Shipment-level records are not. Broken down by destination, the twelve-month picture looks like this:
| Destination | FOB US$ | Share | Shipments | Buyers identified |
|---|---|---|---|---|
| Hong Kong | 191,267,082 | 37.4% | 1,526 | 229 |
| United States | 170,340,668 | 33.3% | 29,929 | 4,245 |
| United Kingdom | 36,272,784 | 7.1% | 7,065 | 1,149 |
| Thailand | 21,629,209 | 4.2% | 637 | 94 |
| Germany | 14,389,760 | 2.8% | 2,308 | 453 |
| Spain | 11,940,041 | 2.3% | 1,233 | 142 |
| Australia | 9,003,826 | 1.8% | 2,176 | 538 |
| Italy | 8,330,764 | 1.6% | 1,051 | 180 |
| United Arab Emirates | 6,003,061 | 1.2% | 436 | 124 |
| Denmark | 5,019,377 | 1.0% | 840 | 117 |
| All destinations | 510,941,006 | 100% | 55,800 | 9,394 |
Two markets carry 71% of the trade, and they behave nothing alike. Hong Kong moves US$191 million on just 1,526 shipments — an average of roughly US$125,000 per consignment, through 229 consolidation and trading houses. It is a wholesale, letter-of-credit, relationship-led market, and most Jaipur and Noida exporters never approach it directly because they have nobody on the ground there. The United States is its mirror image: 29,929 shipments across 4,245 buyers, fragmented, competitive, and already crowded with Indian suppliers.
The commercially interesting money sits in the middle of that table. Thailand at US$21.6 million across 94 buyers. Germany at US$14.4 million across 453. Italy at US$8.3 million across 180. Denmark at US$5.0 million across 117. The UAE at US$6.0 million across 124. Each is large enough to matter and small enough that one focused team can work the entire buyer list inside a quarter.
The concentration trap: a US$4.3 million case study
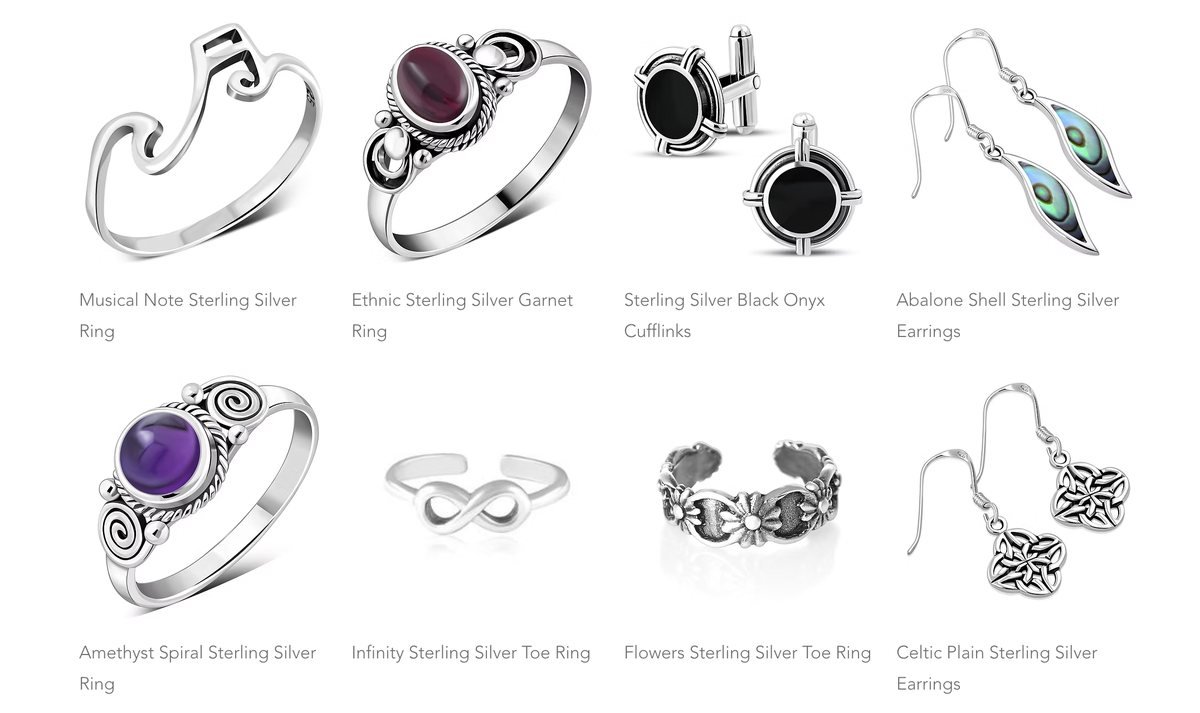
XYZ Exports is not a struggling business. Across the same period, entities trading as XYZ shipped US$4.33 million FOB of 0.925 sterling silver jewellery, chains and findings across 445 shipments to 25 countries, which placed it fourth among Indian exporters of silver chains and findings by value. That is a strong technical position.
It is also an unusually concentrated one:
| Destination | FOB US$ | Shipments | Note |
|---|---|---|---|
| United States | 2,482,104 | 270 | 57.3% of the entire book |
| Philippines | 623,932 | 30 | Effectively a single buyer group |
| Panama | 373,300 | 12 | Lumpy, project-style orders |
| France | 143,727 | 12 | One account |
| United Kingdom | 133,500 | 30 | Mostly marketplace FBA stock transfers |
| Germany | 118,237 | 14 | Marketplace FBA plus one wholesaler |
| Hong Kong | 92,447 | 3 | Own-account transfers, not third-party sales |
| All other (18 countries) | 335,596 | 66 | Sample and trial volumes |
| Total | 4,329,256 | 445 | 25 destinations · 119 distinct buyers |
Three things fall out of that table, and they are true of a great many Indian silver exporters:
- Seventy-one percent of turnover sits in two markets. One tariff change, one buyer consolidation, or one lost account removes a large share of the business at short notice.
- Marketplace revenue is not buyer revenue. A meaningful share of the UK, German and Canadian shipments are e-commerce fulfilment stock transfers. That is logistics, not account development. The wholesale, retail-chain and shopping-network buyers in those same markets — the ones placing repeat six-figure orders — are not customers at all.
- The product is not the problem. XYZ supplies 119 of the 9,394 buyers in the record. That is 1.3% coverage of a market it already competes in successfully. The gap is not demand. It is reach.
India exported US$510.9 million of sterling silver to 9,394 buyers. A top-five chains and findings manufacturer supplies 119 of them.

Where the untapped buyers actually are
Once you subtract every consignee a manufacturer already ships to, what remains is a hard, countable target list. For XYZ, across thirteen proposed territories, that residual pool came to 2,515 identified importing buyers and US$220.5 million of annual FOB value, including 168 accounts importing more than US$100,000 a year.
| Territory | Buyers in market | Not yet supplied | US$100k+ accounts | Untapped FOB pool US$ |
|---|---|---|---|---|
| Hong Kong | 164 | 163 | 30 | 131,840,852 |
| United Kingdom | 914 | 901 | 37 | 32,370,928 |
| Germany | 375 | 370 | 21 | 13,832,729 |
| Italy | 151 | 149 | 18 | 8,101,326 |
| Australia | 438 | 434 | 13 | 6,327,722 |
| United Arab Emirates | 108 | 106 | 9 | 5,845,742 |
| Thailand | 71 | 67 | 12 | 5,661,603 |
| Denmark | 85 | 78 | 9 | 4,752,216 |
| Japan | 93 | 93 | 9 | 3,521,008 |
| Saudi Arabia | 18 | 18 | 1 | 2,758,958 |
| Qatar | 12 | 12 | 2 | 2,667,130 |
| Sweden | 58 | 57 | 3 | 1,620,849 |
| Singapore | 67 | 67 | 4 | 1,227,890 |
| Total | 2,554 | 2,515 | 168 | 220,528,953 |
Note what the Gulf columns do. Saudi Arabia shows eighteen buyers and US$2.76 million; Qatar shows twelve buyers and US$2.67 million. Those are trivially small lists to work and very high average order values — which is why, in our experience, the Gulf is consistently the fastest-converting outreach wave and the right place to start rather than finish.

Who these buyers are — four recognisable types
Behind the numbers, the importers of Indian sterling silver in these markets sort into four groups, and each needs a different approach:
1. TV and digital shopping networks
Germany, the UK, Australia and Japan all have large jewellery shopping channels importing directly from India. They are high volume, price-disciplined, specification-driven, and they place standing repeat orders. Chains and findings sell particularly well into their assembly programmes. They are also slow to qualify a new supplier — expect two to three quarters.
2. Branded retail and DTC houses
The UK, Spanish, Danish, Canadian, Australian and Italian branded jewellery houses run long qualification cycles, demand full compliance documentation, pay materially better realisations, and almost never change supplier once approved. This is where a documented supplier verification trail stops being paperwork and starts being the reason you win the account.

3. Hong Kong trading and consolidation houses
Thirty accounts in Hong Kong import more than US$100,000 of Indian silver a year, several above US$5 million. Volume-led, LC-based, and effectively unreachable by cold email from India — this market is opened in person or not at all.
4. Gulf wholesale and gift trade
Small buyer counts, very high average order values, short decision chains, and a strong seasonal rhythm around wedding and festival calendars.

Why manufacturers do not open these markets on their own
The obstacle is rarely capability. It is three structural problems:
- No presence in the destination. Hong Kong, Germany and Denmark all reward a supplier who can meet a buyer, hold a sample review and answer a compliance query in the buyer’s own timezone.
- Qualification cycles outlast enthusiasm. Most in-house export desks give a new market one or two quarters before reallocating effort back to the accounts that are already producing — which is precisely why the concentration in the first table never changes.
- Commission-only agents will not do this work. Paid solely on results, an agent rationally works the fastest-closing buyers and abandons anything slower. Nobody opens a German shopping network or a Danish design house on pure commission.

How the ZJELL EMC model solves it
ZJELL Limited operates as an Export Management Company, not a lead-generation service. The distinction matters: an EMC becomes the manufacturer’s outsourced export sales department. It finds the buyer, qualifies them, negotiates against the manufacturer’s own approved price list, places the order with the manufacturer, and stays on the account for the repeat business — under the manufacturer’s brand, not its own.
Buyer registration protects both sides
Every target account is notified to the manufacturer before any approach is made. The manufacturer confirms within three working days whether the account is free or already held. Existing accounts are ring-fenced entirely, with nil commission payable on them. In the XYZ engagement, the US, Philippines, Panama and France books were ring-fenced from day one — there is no scenario in which two teams call the same buyer.
Retainer plus commission, deliberately
Silver has a structural pricing problem for agency work: the metal is a pass-through cost, so a commission quoted on gross FOB looks generous to the agent and unaffordable to the manufacturer. The fix is a modest monthly retainer that funds dedicated buyer development in the slow markets, paired with a commission rate well below what a pure-commission agency would need to quote — with half the retainer credited back against commission as the accounts start producing.
| Component | Basis |
|---|---|
| Monthly retainer | Funds named-account mapping, outreach, CRM and reporting |
| Commission — exclusive territories | 5.0% of FOB invoice value, on registered buyers only |
| Commission — non-exclusive territories | 4.0% of FOB invoice value, on registered buyers only |
| Commission — existing / legacy accounts | Nil. Ring-fenced |
| Retainer offset | 50% of retainer credited against commission earned in the same quarter |
| Buyer registration protection | 24 months from first shipment, including repeat orders placed direct |
| Commission payment | 30 days after the manufacturer receives the buyer’s remittance — never before |
| Blended cost of sale, Year 1 | ≈5.7% of incremental FOB, falling as accounts repeat |
On a Year 1 target of US$1.2 million of incremental FOB — a 28% uplift on XYZ’s existing book, and just 0.6% of the untapped pool identified above — the total cost to the manufacturer works out at roughly 5.7% of incremental sales. Commission is paid only after the manufacturer has been paid.
Presence where the buyers are
ZJELL runs five hubs, and each earns its place in an engagement like this one: Hong Kong for the single largest destination for Indian silver and for LC handling; London for UK, Ireland and EU retail and shopping-network access; Delhi NCR and Mumbai for origin-side work — factory visits, sample dispatch, DGFT and documentation; Guangzhou for benchmarking Chinese competition on chains, findings, packaging and display; and Vietnam for tariff-smart routing if duty positions shift.

What a twelve-month engagement looks like
| Phase | Activity | Timing |
|---|---|---|
| 1 | Onboarding — price list, MOQ, lead times, capacity, certifications, catalogue review; territory and registration protocol agreed | Week 1 |
| 2 | Market & Buyer Plan — named accounts per territory with current supplier mapping, order sizes and buying calendar | Week 2–3 |
| 3 | Outreach wave 1 — Gulf and Hong Kong (fastest converting), plus Thailand | Week 3–8 |
| 4 | Outreach wave 2 — Germany, Italy, Denmark, Sweden, Singapore | Week 6–16 |
| 5 | Outreach wave 3 — UK, Australia, Japan on a registered-buyer basis | Week 10–24 |
| 6 | First orders, documentation, hallmarking and shipment support | From week 8 |
| 7 | Month 6 review — performance against target, territory and rate review | Month 6 |
What you need ready before you start
If you are a silver jewellery manufacturer considering this route, the onboarding pack is short and it is the same every time:
- Export price list or making-charge structure by product family, with MOQ and lead time
- Monthly production capacity in kilograms, and current headroom
- Product catalogue and high-resolution imagery — a lookbook if you have one
- Certifications held: BIS hallmarking, RJC, SEDEX, ISO, assay office registrations, and confirmation of nickel/cadmium and REACH compliance for EU shipments
- A definitive list of existing accounts and countries to be ring-fenced
- One named person empowered to approve quotations inside an agreed price band
Manufacturers who cannot produce the first and fourth items quickly are usually not ready for the German or Danish buyer conversation yet — and that itself is a useful finding to reach in week one rather than month four. Buyers increasingly check a verified manufacturer listing before they reply to a first email.
Frequently asked questions
How large is silver jewellery export from India?
Indian customs recorded US$510.9 million FOB of HS 7113 jewellery exports across 55,800 shipments in the twelve months to January 2025, reaching 9,394 identified overseas buyers in 100 countries. Hong Kong (37.4%) and the United States (33.3%) took roughly 71% of that value.
Which markets are most underserved by Indian silver exporters?
On the shipment record, the strongest combinations of value and small, workable buyer counts are Hong Kong, Thailand, Germany, Italy, Denmark, Sweden, Singapore and the Gulf states — the UAE, Saudi Arabia and Qatar. The Gulf in particular offers very high average order values against buyer lists of only twelve to a hundred accounts.
What is the difference between an EMC and an export agent?
A commission agent introduces a buyer and moves on. An Export Management Company runs the export sales function: named-account mapping, buyer qualification and credit sense-checks, quotation and negotiation against your price list, order capture, documentation and compliance review, logistics and LC support, and ongoing account management for the repeat business.
What does an EMC engagement cost?
Structures vary by product and territory. The illustrative model above — a monthly retainer with 4–5% commission on registered buyers, half the retainer credited back against commission, and nil commission on ring-fenced legacy accounts — produced a blended Year 1 cost of about 5.7% of incremental FOB, falling in later years as accounts repeat.
Are existing customers at risk?
No. Every account is registered before approach, existing buyers are ring-fenced by name, and no commission is payable on them. That protocol is agreed in week one, before any outreach begins.
The takeaway
Silver jewellery export from India is not a market with a demand problem. It is a market with a coverage problem. The buyers are named in the customs record; the order sizes are visible; the compliance requirements are knowable. What separates a US$4 million export book from a US$6 million one is usually not product — it is whether somebody is working the other 2,515 buyers.
If you manufacture sterling silver jewellery, chains or findings in India and want the same analysis run on your own shipment record, talk to the ZJELL Import–Export Consulting desk. We will map your existing buyers out of the full HS 7113 export record and size your untapped pool before we propose anything. Overseas buyers looking to source from India can post a requirement instead.
Related reading: What customs data reveals about Indian ladies’ jumpsuit demand in Europe and the USA.
About the data. All market, buyer and shipment figures in this article are derived from Indian customs bill-of-lading export records for HS Chapter 7113 (articles of jewellery of precious metal) covering 22-01-2024 to 18-01-2025, comprising 55,800 unique shipment records with a total declared FOB value of US$510,941,006. Buyer counts are de-duplicated on a normalised consignee name; consolidators, freight forwarders and unnamed “To Order” entries are excluded. The data window predates subsequent changes in tariff and trade-agreement positions — see our trade agreements and tariffs pages for current duty positions, and do not read this article as a duty guide. Trade data reflects declared shipment values and is indicative of market structure and buyer activity — it is not a forecast, and it does not guarantee that any buyer will place an order. Manufacturer and buyer identities have been anonymised. Photographs are for illustration and do not depict the manufacturer described.